Satya's blog

Friday, September 09, 2011

Earned Value Over Time Report

Three measures represent the pillars of earned value analysis:
  • Planned cost for scheduled work is also known as the budgeted cost of work scheduled (or BCWS, which is the name of the corresponding Project field). This is the cost you estimated for the work scheduled through the status date -- in other words, the baseline cost for the work that should be completed as of the status date.
  • Planned cost for completed work is called earned value, because it's the baseline cost the project has earned with completed work as of the status date. The other name is budgeted cost of work performed or BCWP.
  • Actual cost of completed work is how much you actually spent as of the status date.
Because planned value, earned value, and actual cost are all measured as money, you can compare them to check schedule and cost performance. The Earned Value Over Time visual report, found in Project 2010, shown in the screenshot, presents all three measures over time.
Biafore figure 2
  • If earned value is less than planned value, less work is actually completed than you estimated, so the project is behind schedule.
  • If the earned value is greater than the actual cost, the work you've completed cost less than you estimated so the project is under budget.
Read more ยป

Labels:

How To Display Lag between Tasks in Your Gantt Chart


By default, the lag set between tasks is displayed in the Predecessor column of the Gantt chart view. Neither Microsoft Project 2007 nor Project 2010 has a separate field to display the lead or lag of specific tasks.
You can display the lag as a separate field by following these steps:
1. In Project 2007 choose Tools, Customize Fields. In Project 2010 choose Project ribbon | Custom Fields in the Properties group.
2. In the Custom Fields dialog, select the Task radio button. Then choose the Type drop down and select Text.
3. Select Text1 and click the Rename button. Change the name to "Lag" and choose OK. This will display "Lag (Text1)."
4. Click the Formula button of Custom attributes, enter the following formula, and click OK:
IIf(InStr([Predecessors],"+")<>0, Mid([Predecessors],InStr([Predecessors],"+"),Len([Predecessors])), "")
You'll get a warning message that existing data in the Lag field will be deleted because now all values will be calculated by the formula. Click OK.
5. Insert a column with the Field name as Lag (Text1) in Project 2007 by choosing Insert | Column. In the Field name dropdown, choose Lag (Text1). In Project 2010, just right-click on the column next to which you want the new column added and choose Insert Column. Scroll down to Lag (Text1) and select it.
Prasad figure 1
You may be wondering about that formula I've asked you to enter. What does the code mean?
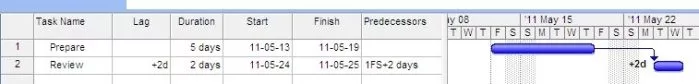
For the purposes of illustration, let's say the lag between Prepare and Review tasks is 1FS+2days (translated to: "The task is planned to Start with a lag time of two days after the Finish of its predecessor task").
The part of the code that specifies:
InStr([Predecessors],"+")
returns the position of + in the [Predecessors] field. That's four in the example shown in the screenshot.
This code:
Mid([Predecessors],InStr([Predecessors],"+"),Len([Predecessors]))
extracts the text from + to the end of the string, which is "+2days."
If you want display the lag to the right or left of the task bar, follow these steps:
1. In Project 2007 choose Format | Bar Styles. In Project 2010, choose Format ribbon | Bar Styles in the Bar Styles group.
2. Select the rows in the top area that you want the lag displayed next to.
3. Select the Text tab in the bottom and choose the dropdown for Left or Right.
4. Select the field name Lag (Text1) and press OK.
B. Sai Prasad
Sai Prasad, MCTS, PMP, PMI-SP, has been with service provider Cognizant since 2001, where he was named winner of the company's Global Trainer of the Year award. Sai has conducted 5,000-plus hours of training in technical and project management topics. He's also the editor of the project management book, Forecast Scheduling with Project 2010. You can read Sai's blog at http://www.sainivas.com. Contact him at mailto: sai@sainivas.com.

Labels:

Tips on Handling a Problem Team Member on your Project


Oh, there is a problem all right. And it starts with the fact that you have a boss, peer, or project team member who is in complete denial about the chaos all around them. If they do see any issues, well, those issues start with you. This is not meant to be spiteful. This is the behavior of someone who is completely oblivious to the fact that they cause problems. If they do have any inkling that there is an issue, then they have a perfect excuse. Do any of these sound familiar?
  • "I didn't call you back because you never left me a message."
  • "I didn't forget our meeting; my admin did not put it on my calendar."
  • "My office may look messy, but leave it alone. I have a system and I know where everything's located."
What kinds of chaos surround this person? Their chaos can be lack of organization, time related or memory related. The chaos created by this person looks like chaos created by creative types or even by someone who deceives others into thinking they're organized. The key here is that they absolutely can't seem to own their issue. They really don't see a problem with how they're performing.

Tips on Handling a Problem Team Member on your Project...

Labels:

What's Going on This Week?

Has anyone ever written a process/macro/view/something whereby I can produce a timesheet of sorts that tells my resources what tasks they're to work on this week, possibly using the Gantt view? Answer: This is something that many people have asked me about, and there are several solutions available depending on what you're looking for. If you want a Gantt chart view, you could try applying the filter, "Using Resource," which would show only tasks where a specific resource is being used. Keep in mind that you'll have to run this separately for each resource. If you wanted to take this to the next level and group the work by week, this would give you a clearer idea of how the work is distributed for each resource Refer following site: http://www.mpug.com/News/Pages/AsktheExpertsWhatsGoingonThisWeek.aspx

Labels:

8 Tips for an Effective Status Report

8 Tips for an Effective Status Report : Good article from Alec Satin

Labels:

Creating a report using Task and Resource Data

I would like to have a report that would show the task name, the
resources assigned with their skills, department and email addresses. How can I create this
report?


Pl. refer http://www.lehnertcs.com/pdfs/201004_ezine.pdf for detailed solution

Labels:

PMO-In-A-Box (P3MO)


Most PMOs want to boost the flexibility of their methodologies, with 35% planning to decrease the number of mandatory deliverables and 50% expecting to increase the number of optional deliverables across the next two years.
In business today delivery speed is at a premium, but most methodologies slow delivery.
Pcubed P3MO contains ready to go processes, tools and approaches that boost speed and enhance flexibility allowing you to manage agile development across a range of external suppliers.
The modular approach of Pcubed PMO makes it flexible, so you can use only the portions you need, for help with executive support, governance control, creating a center of excellence, benefits management, and more. We help you to quickly get started or back on track fast.

 
Refer Pcube site for more details: http://www.pcubed.com/services/tools.pm30_framework.aspx

Project Management Office

Labels: